Allinea Performance and Debugging Tools Workshop
Cristian Cira, PDC
The high performance computing software specialists Allinea ran a technical workshop at PDC on the 25th of January 2016. The course gave an overview of Allinea's tools for debugging (DDT) and performance analysis (MAP). The first part of the day focused on their flagship product, Allinea DDT, which is a widely used tool for debugging parallel code. DDT can point to a part of the code and indicate the processing element (PE) responsible for erroneous behaviour. The tutorial during the course consisted of examples ranging from identifying straightforward crashes to MPI deadlocks and memory leaks.
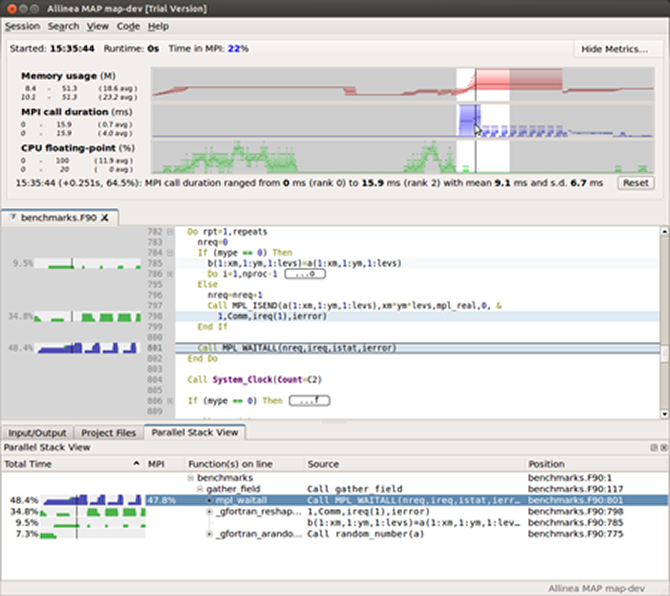
Among the interesting new features that were presented during the workshop, it is worth mentioning the version-controlled detection mechanism and the Allinea Forge graphical user interface (GUI). This user interface has matured into a common interface for both DDT, and Allinea's profiling tools (like MAP). MAP gathers samples of performance data from running applications and reports the results in graphical form in Allinea Forge. This common interface facilitates a very smooth transition between debugging and performance analysis, offering an intuitive and direct way to navigate and to identify bogus code, as well as bottlenecks or hotspots. If you missed this workshop by Allinea, we recommend that you keep an eye on the PDC mailing list or website for future courses.